
Take the First Step Toward Cybersecurity Excellence
Why Nexusguard?
Over 15 Years
Trusted by 100+
Protecting 50,000
40+


Learn More About Nexusguard Academy Courses
Let’s Start the Conversation
Why Nexusguard?
Over 15 Years
Trusted by 100+
Protecting 50,000
40+


Get in Touch with Our Experts
Let’s Start the Conversation
Why Nexusguard?
Over 15 Years
Trusted by 100+
Protecting 50,000
40+
Seeing Inside the Kernel: How Nexusguard Uses eBPF for High-Precision Observability and Security

Gao Shen
Nexusguard

Share to:
A practical look at how eBPF enables precise, low-overhead observability in modern security platforms
Introduction: Why Observability Breaks Down in Modern Security Systems
When something goes wrong in production, the problem is rarely that we don’t know something happened. CPU spikes, latency increases, dropped packets — traditional monitoring systems are very good at telling us that.
What they are far less effective at is answering the question that matters most during an incident:
What exactly happened inside the system, at the moment it happened?
For modern security platforms — especially those operating at scale, inside containerised environments, and under attack conditions — this gap is critical. Many important behaviours occur deep inside the Linux kernel or along application execution paths — areas that are effectively invisible to user-space tools and sampled metrics.
At Nexusguard, one of the key technologies we rely on to close this gap is eBPF.
What Is eBPF?
eBPF (Extended Berkeley Packet Filter) can be understood as a sandboxed virtual machine running inside the Linux kernel.
It allows developers to dynamically load small programs into a running kernel, where they can safely observe and react to system events — without modifying kernel source code, loading kernel modules, or restarting the system.

This diagram illustrates where eBPF programs execute inside the Linux kernel, how they are verified and JIT-compiled, and how data flows safely back to user-space via eBPF maps.
Three core properties make eBPF viable for production systems:
Safety by Design
All eBPF programs must pass a kernel verifier before they are allowed to run. The verifier ensures programs cannot crash the kernel, enter infinite loops, or access invalid memory. This is a fundamental difference from traditional kernel modules, where a single bug can bring down the entire system.
High Performance
Once verified, eBPF programs are JIT-compiled into native machine code. This allows them to execute with very low overhead and without the constant user-kernel context switching required by many traditional tracing tools.
Zero-Downtime Instrumentation
eBPF programs can be loaded and unloaded dynamically, enabling live diagnostics and observability without service disruption.
How eBPF Works in Practice
From an engineering perspective, a typical eBPF workflow looks like this:
- An eBPF program is written (usually in C, or via frameworks such as BCC or bpftrace).
- The program is compiled into eBPF bytecode.
- The bytecode is loaded into the kernel using the bpf() system call.
- The kernel verifier performs safety checks.
- The program is JIT-compiled into native machine code
- The program is attached to a specific event.
- When the event occurs, the program executes and records data.
Collected data is usually written into eBPF maps, which act as the communication channel between kernel-space eBPF programs and user-space applications.
Why eBPF Maps Matter
By default, eBPF programs are stateless. Each execution runs independently and cannot remember what happened previously. eBPF maps solve this limitation.

eBPF maps act as the primary communication bridge between kernel-space eBPF programs and user-space consumers, enabling state, aggregation, and controlled data sharing.
eBPF maps are kernel-resident key-value stores that allow:
- Persistent state across events
- Aggregation and counting
- Safe data sharing between eBPF programs
- Controlled access from user space
Without maps, eBPF would be limited to transient observations. With maps, it becomes a foundation for real observability and monitoring systems.
Table 1 - eBPF Map Types
Attaching to Reality: Event Triggers
eBPF programs execute in response to events. The three most commonly used attachment mechanisms are:
Kprobes
Dynamic probes that attach to almost any kernel function. They offer great flexibility but can be sensitive to kernel version changes.
Uprobes
User-space probes that attach to functions inside application binaries. They allow deep inspection of application behaviour without modifying application code.
Tracepoints
Statically defined kernel hooks with stable interfaces and lower overhead. They trade flexibility for long-term stability.
In real-world systems, these mechanisms are often combined depending on performance, stability, and observability requirements.
Table 2 - Comparing eBPF mechanisms
In production systems, these mechanisms are often combined to balance stability, visibility, and performance overhead.
From Generic Tools to Real Diagnostics
The eBPF ecosystem includes powerful tools such as:
- bcc tools (e.g. tcptop, execsnoop)
- bpftrace, which allows eBPF programs to be written in a script-like manner
These tools make it possible to:
- Observe real-time network behaviour
- Capture process creation events that traditional tools miss
- Measure function-level execution latency without modifying application code
In one real diagnostic scenario, we used bpftrace to trace the execution time of a specific function inside a WAF engine. This allowed us to identify performance bottlenecks that would have been extremely difficult to isolate using logs or sampled metrics alone — all without recompiling or redeploying the application.
To illustrate how eBPF can observe user-space behaviour without code changes, consider the following simplified example.
func randomSleep() {
duration := time.Duration(rand.Intn(3000)) * time.Millisecond // 0-3000ms
time.Sleep(duration)
}
The following bpftrace script attaches to the function at runtime and measures its execution latency, without recompiling or restarting the application.
#!/usr/bin/env bpftrace
/*
* bpftrace script: Monitor randomSleep function execution time
*
* Usage:
* sudo bpftrace monitor_timing.bt -p <PID>
*/
uprobe:./main:main.randomSleep
{
@start[tid] = nsecs;
}
uretprobe:./main:main.randomSleep
{
$duration_ms = (nsecs - @start[tid]) / 1000000; // Convert to milliseconds
printf("randomSleep execution time: %llu ms\n", $duration_ms);
// Statistics: total calls and average time
@calls = count();
@avg_time = avg($duration_ms);
delete(@start[tid]);
}
BEGIN
{
printf("Starting to monitor randomSleep function execution time...\n");
printf("Press Ctrl+C to stop monitoring\n\n");
}
END
{
printf("\n=== Statistics ===\n");
printf("Total calls: ");
print(@calls);
printf("Average execution time: ");
print(@avg_time);
printf(" ms\n");
printf("==================\n");
}
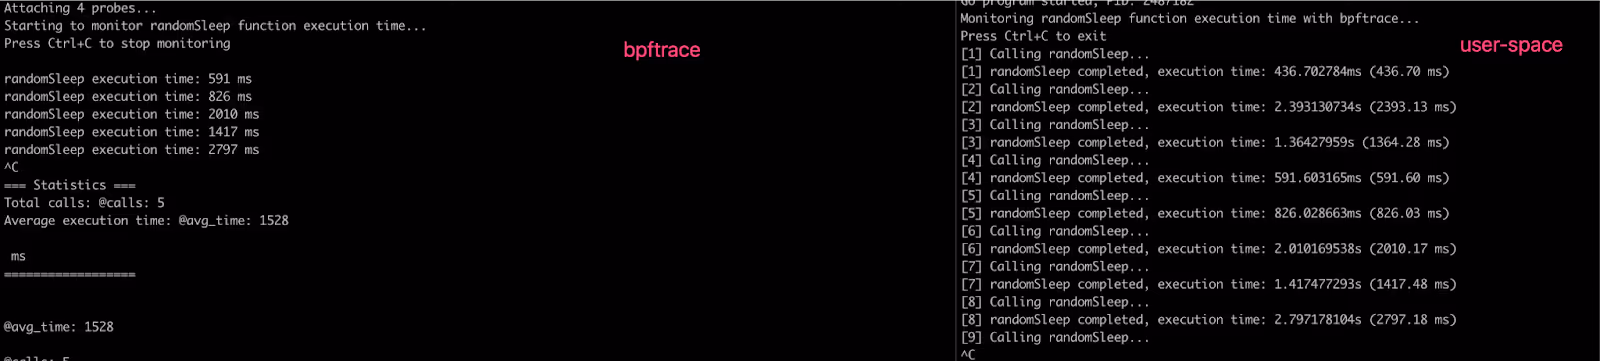
Live bpftrace output showing real-time function execution latency, collected from a running process without application instrumentation.
Why We Built an eBPF Monitor at Nexusguard
As our platform evolved, several limitations became clear with traditional monitoring approaches:
- Metrics collection tools often produced large volumes of data we did not need, while missing metrics that mattered.
- Sampling-based execution introduced inaccuracies.
- Monitoring business-specific logic required intrusive code changes.
- Limited and inconsistent support for container- and cgroup-level observability.
To address this, we built an eBPF Monitor tailored to Nexusguard’s operational needs.
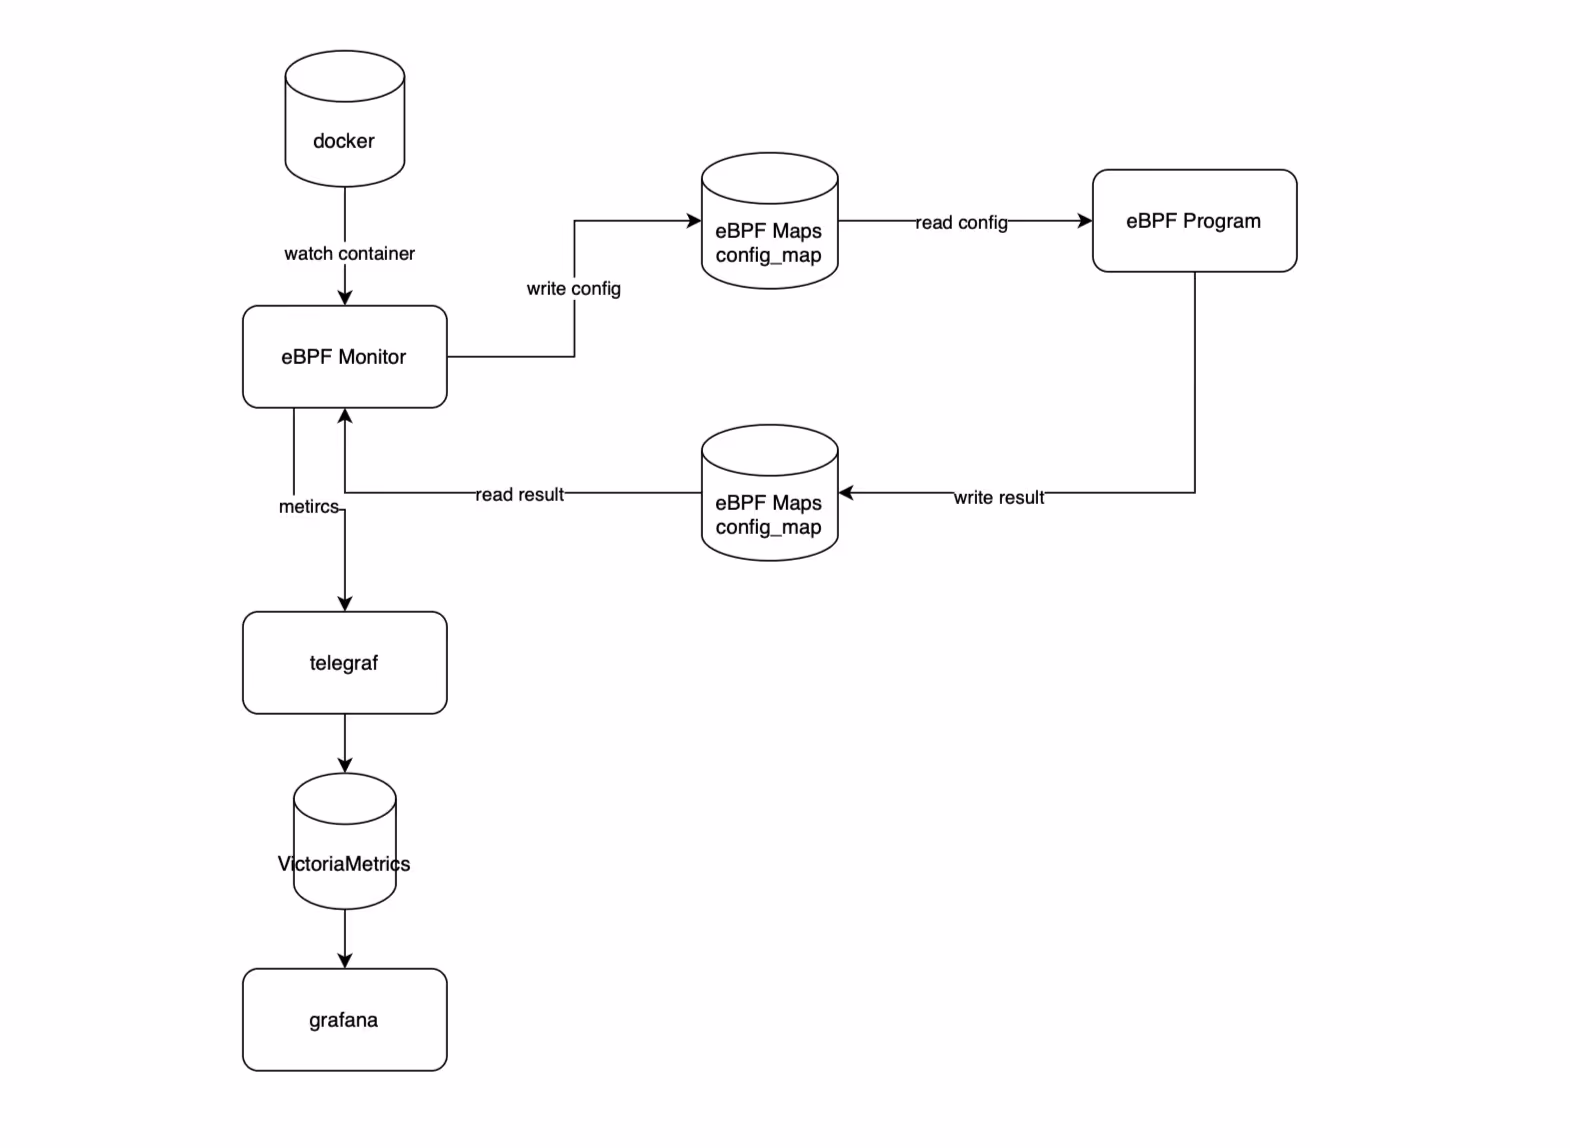
A simplified view of Nexusguard’s eBPF Monitor architecture, showing how kernel-resident eBPF modules collect event-driven data, share state via maps, and export structured metrics to user-space systems.
At a high level:
- eBPF modules run inside the kernel and collect event-driven data.
- Configuration is passed dynamically via eBPF maps.
- Collected data is exported to user space, transformed into metrics, and integrated with existing monitoring pipelines.
- The system dynamically adapts to container and process restarts without requiring eBPF program changes.
Safety, Resource Control, and Production Use
Running instrumentation inside the kernel naturally raises concerns about safety and overhead.
eBPF addresses these concerns through:
- Strict verifier-enforced limits
- Bounded execution time
- Controlled memory access
- Predictable runtime behaviour
These constraints allow deep observability to be deployed confidently in production environments.
What This Means for Nexusguard Customers
By leveraging eBPF as part of our platform architecture, Nexusguard is able to:
- Observe behaviour where it actually occurs
- Diagnose issues faster and with fewer assumptions
- Reduce reliance on invasive debugging techniques
- Maintain performance even under heavy load
For customers, this translates into greater reliability, faster incident response, and more accurate protection decisions.
Closing Thoughts
As systems become more dynamic and attacks more sophisticated, observability must move closer to the execution path itself.
eBPF gives us that capability.
At Nexusguard, it is not a standalone feature, but a foundational technology that strengthens how we build, operate, and evolve our security platform — quietly, safely, and precisely inside the kernel.
Protect Your Infrastructure Today


Related Articles

Could “QUIC” turn into the next most prevalent amplification attack vector?

Empowering Resilient Networks with Nexusguard’s TCP Connection Flood Protection
